Why would someone need an alternative to IBM Cognos Analysis Studio?
After the last two versions of IBM Cognos Analytics with Watson, 11.2.4 (LTS) and 12, were released in early June 2023, long-time Cognos users find themselves in need of a new self-service tool for creating custom analyses.
Version 11.2.4 (long-term support) is the final release of IBM Cognos Analytics that includes Query Studio and Analysis Studio, but it is limited to certain web browsers, and starting with version 12, both of these studios are no longer supported.
Since the transition to the long-term support version 12, once it becomes available, will likely be unavoidable, these three solutions could serve as a replacement for Analysis Studio:
- Dashboard
- Self-service analytics (in Report Studio)
- Page preview (in Report Studio)
Two more alternatives still work in version 11.2.4 today, but they may not be long-term solutions. We will touch on them briefly at the end of this blog.
First, let’s look at what made IBM Cognos Analysis Studio the powerful tool we all know today so we can better understand what we might get from the alternative solutions.
IBM Cognos Analysis Studio was used, and is still used, to better understand business operations and get quick answers to questions someone might ask about the business. Users can perform analysis to uncover the information behind a number representing an event, for example product sales. They can then act on that information and improve business performance.
With its interactive drag-and-drop environment, you directly interact with visible, large volumes of multidimensional data, and that is what users will miss. Or will they?
Dashboard
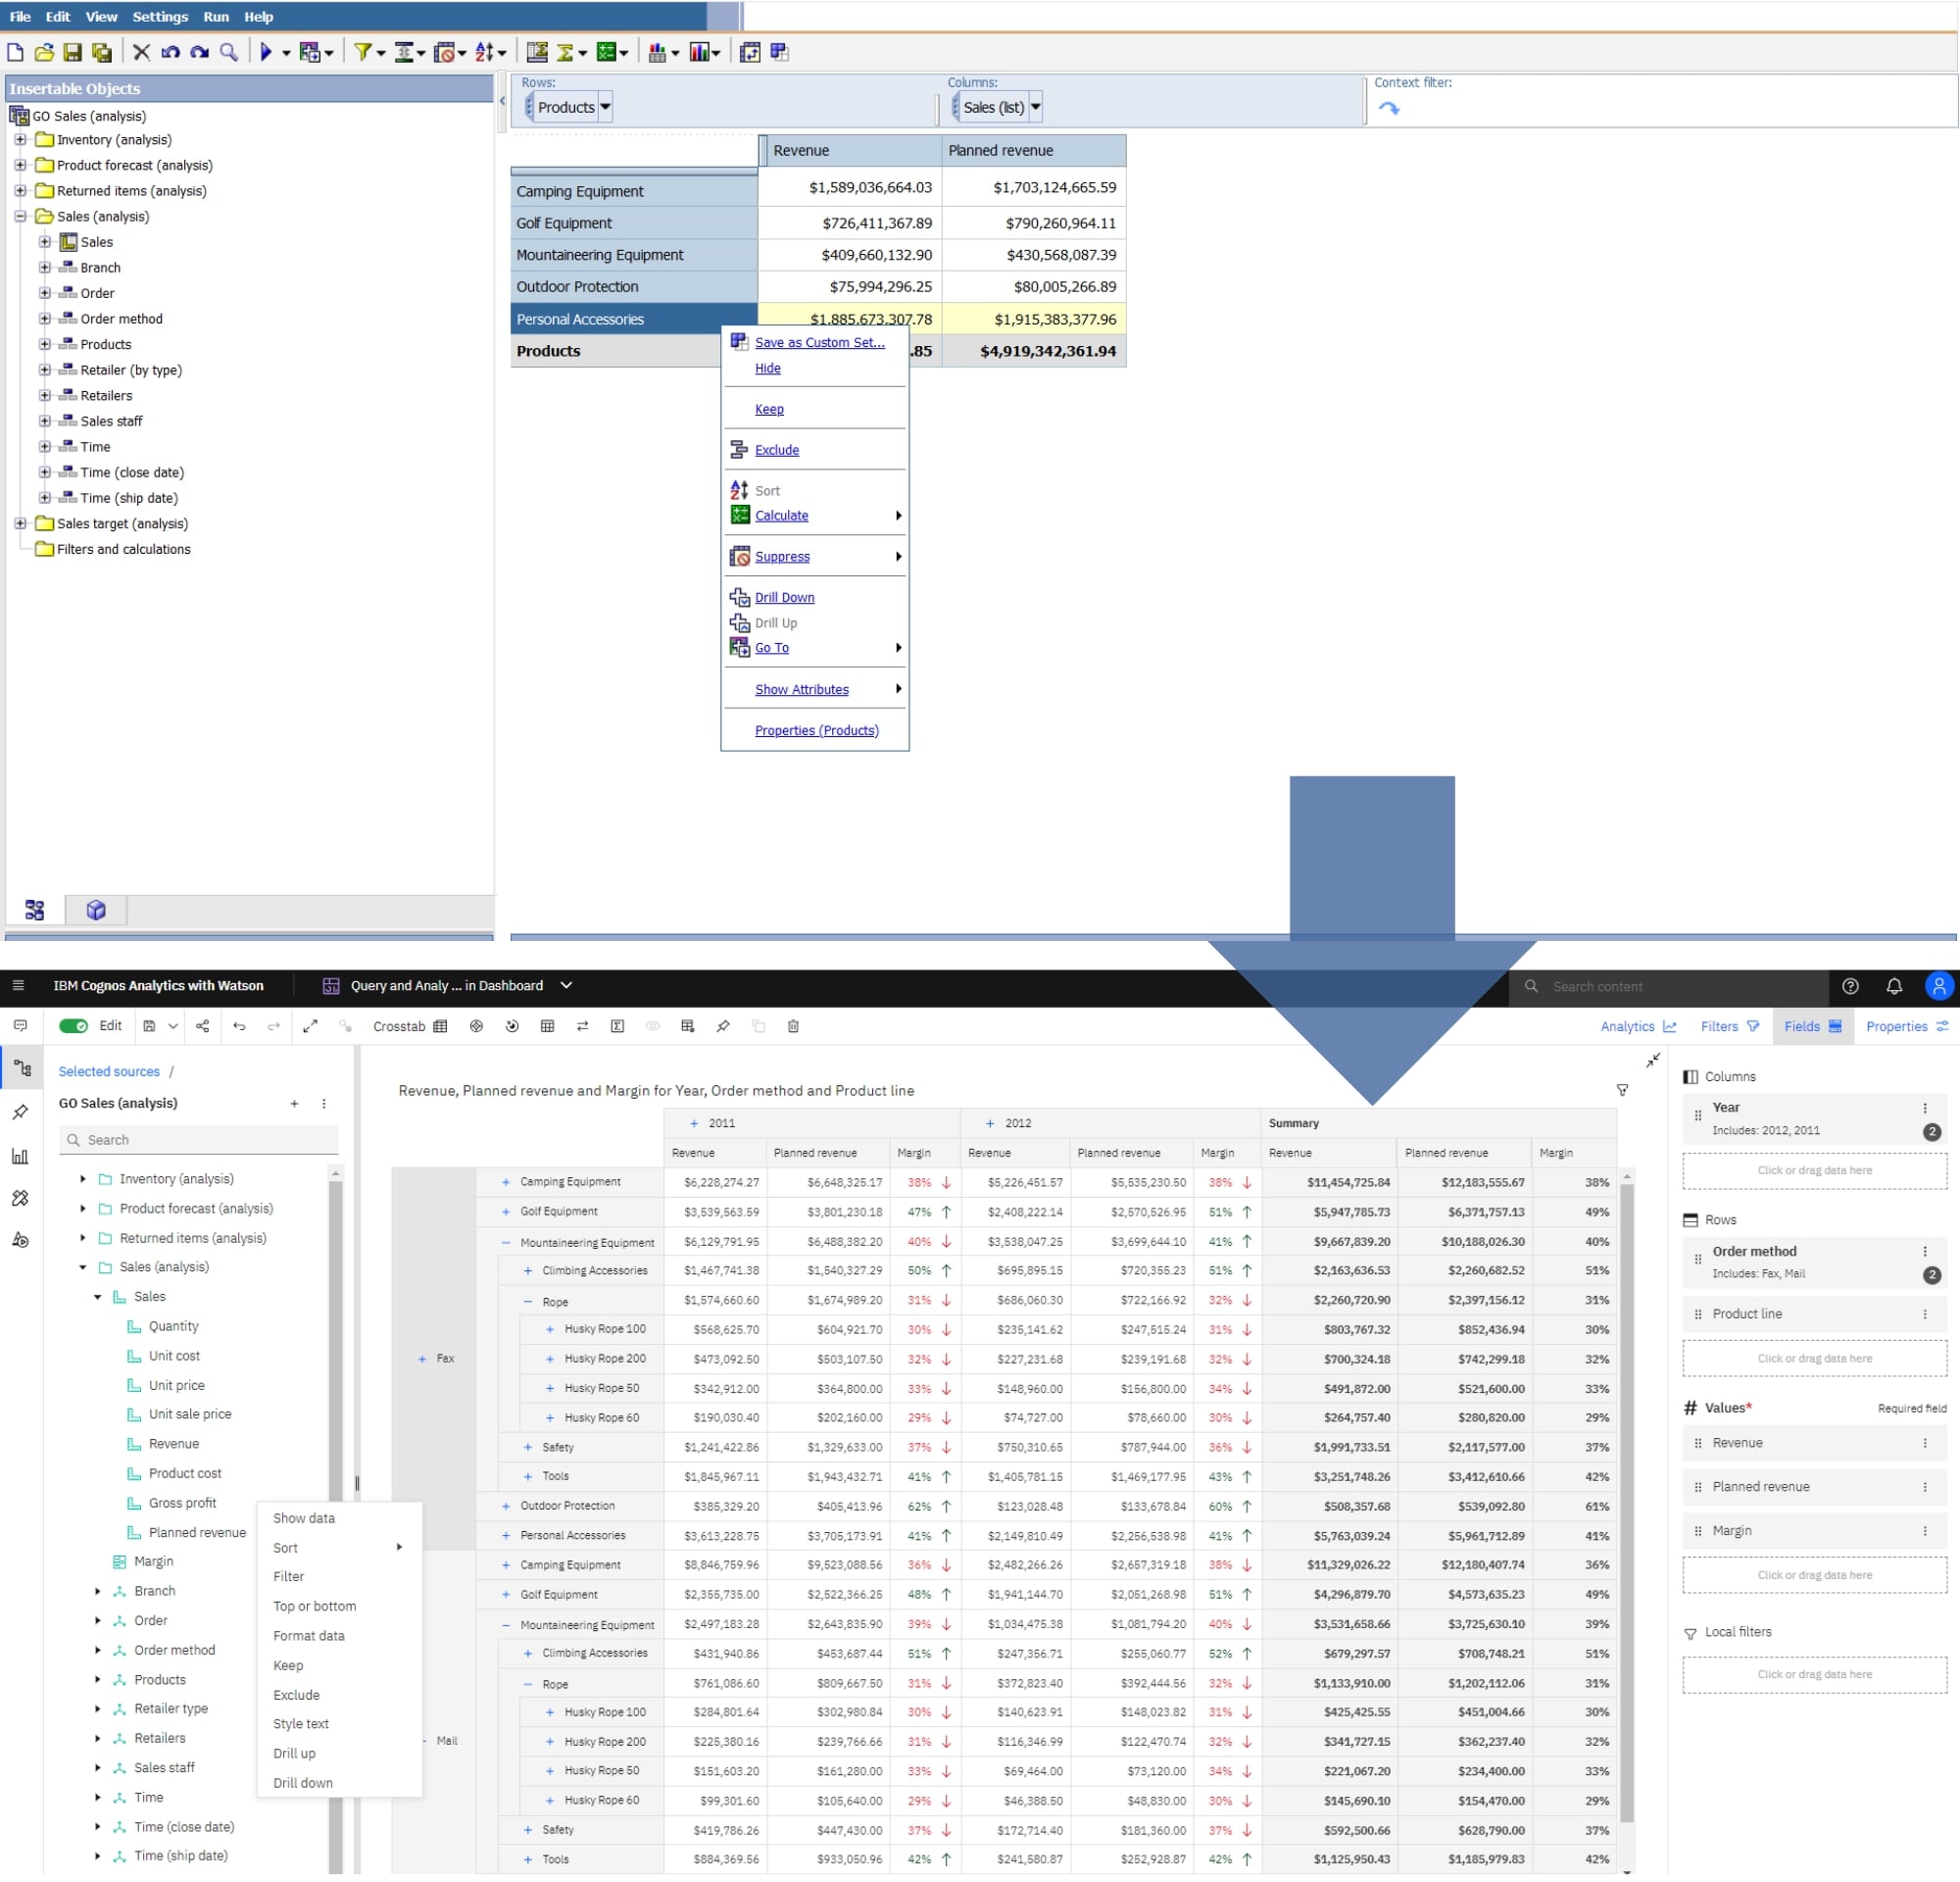
The Dashboard is designed as a multi-purpose self-service tool that can include functionalities of Query Studio and Analysis Studio. Of course, not all functionalities of Analysis Studio are available on the dashboard (more about the specific differences can be found in the link “Comparison of Analysis Studio and Query Studio features with reporting and dashboard features”), but you can get close to the Analysis Studio experience.
The dashboard also offers a drag-and-drop environment where users can interact with visible data.
The Crosstab object on the dashboard is used to simulate nesting functionality similar to that in Analysis Studio.
The dashboard offers the same drill-down function that was possible in Analysis Studio but improves the visual experience with the familiar expand/collapse buttons – plus and minus.
Additionally, the dashboard table and the crosstab object allow conditional formatting and the use of performance indicators.
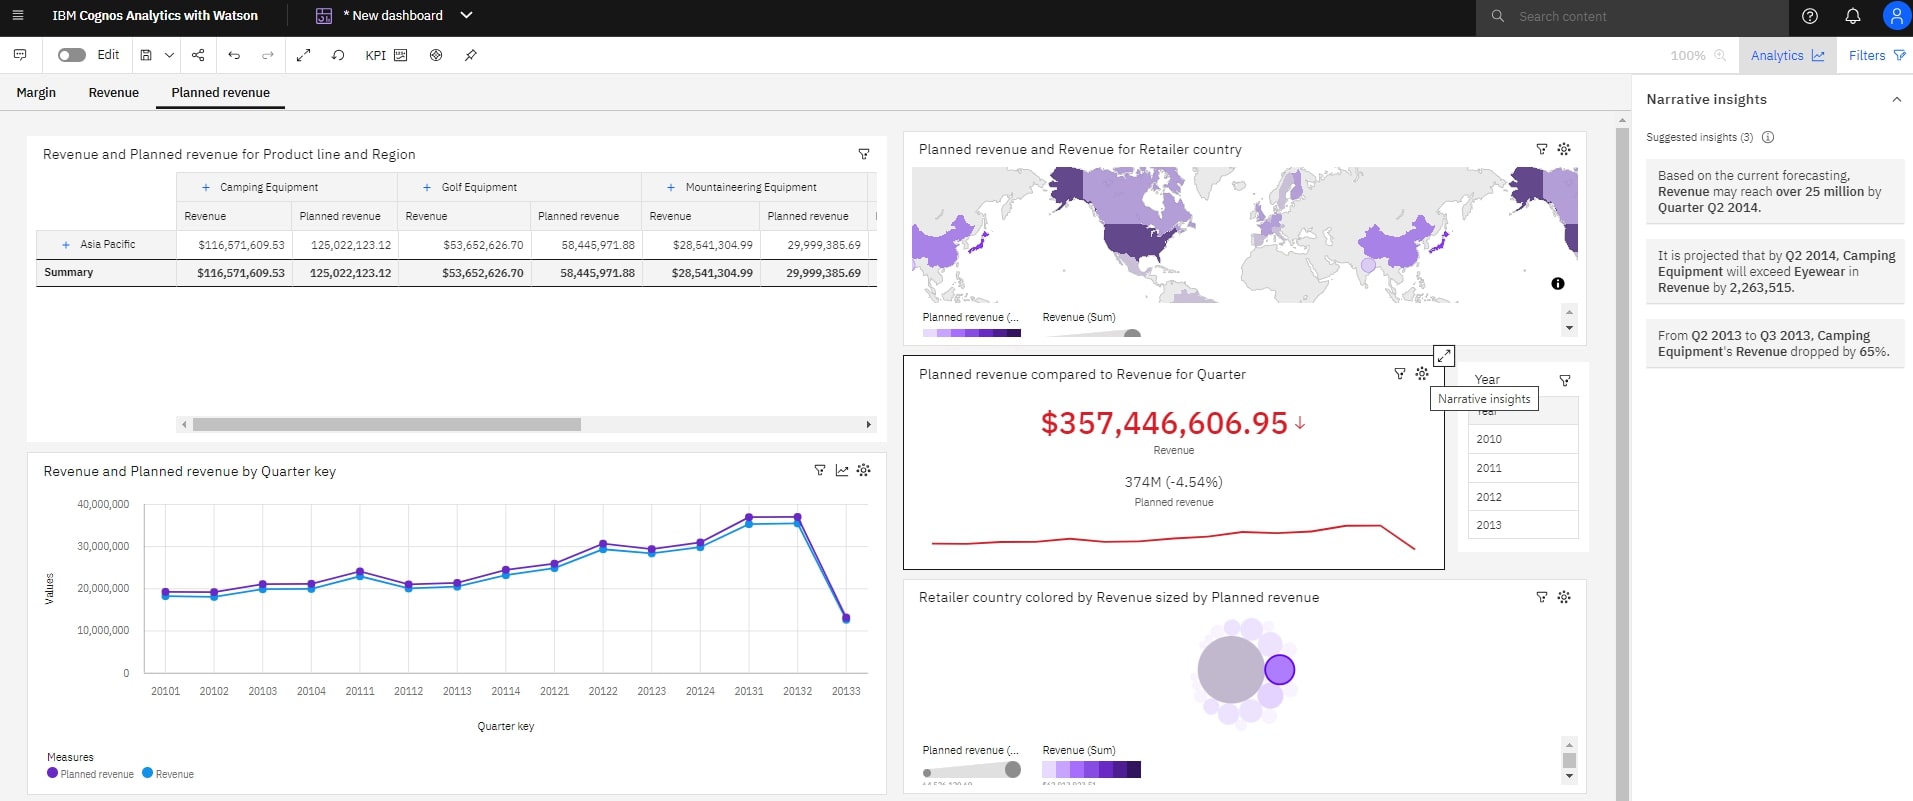
Together with table-style visualizations, the Dashboard offers many more self-service functions such as combining a table or crosstab with charts, setting up cascading filters that help you focus your data, or using narrative insights to view significant aspects of chart data in natural language. You can consult the Assistant to help you create new tables, crosstabs, and charts, or even generate a completely new dashboard using natural language commands such as “create a dashboard for…”, which can be a good starting point on your self-service journey.
Self-service analytics in Report Studio
“Report Studio as self-service?” It may sound a bit strange, I know, but it makes sense. This solution may not be as simple as the Dashboard, but it is still a viable option if, for some reason, the Dashboard is not an option for you.
Report Studio is a far more complex and comprehensive tool than the dashboard, which means you can do much more. The complexity may seem intimidating to some, but it doesn’t have to be.
The self-service feel will be visible to the report’s end user, and once configured, it can be quite powerful thanks to the flexibility that Report Studio offers.
“Well, I can do that on the dashboard with simple drag-and-drop, so why would I go this more complex route?”
In that regard, I would say you are right, but… Besides being able to select any dimension or level within a dimension, nest them, and analyze them just like in Analysis Studio, there are still some superior features in Report Studio compared to the Dashboard, such as:
- queries
- prompting
- custom sorting
- and more options related to:
- suppression
- output reports
- conditional styles
- formatting
- calculations
- functions
If this still seems intimidating, there is a third option that is simpler in Report Studio.
Page preview in Report Studio
This option still includes the same self-service elements as the other alternative, but it requires more user skill, and if the skills are not adequate, the user might create reports that resemble Frankenstein. For now, let’s assume that the user has been trained to use this alternative. What could the user do to get the what and why from the data?
With a simple crosstab, the user could drag and drop data from the Sources tab while still having all the options for nesting, sorting, etc., without needing to create complex queries for it as required in the other alternative.
The difference is that the second alternative should be created by someone who knows what they are doing in the IBM Cognos Report Studio environment, and the end user only uses the finished report, while here the user has all the power that Report Studio offers, which could be the least sustainable option among the three proposed alternatives.
If all else fails…
Legacy studios such as Query and Analysis Studio in IBM Cognos Analytics version 11.2.4 are still supported in the Mozilla Firefox web browser (check this link “Enable Legacy Studios in Cognos Analytics 11.x”).
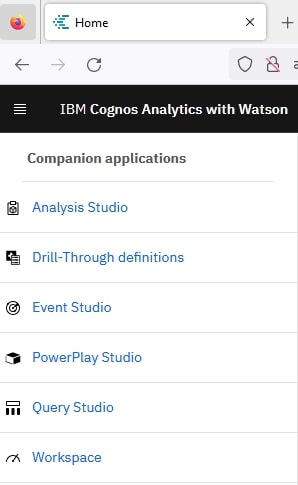
Unfortunately, starting from version 12.0.0, Query Studio, Analysis Studio, and Cognos Workspace have been removed (see this link “Deprecated and removed features in 12.0.x”).
I hope the alternatives listed in this blog have helped you in one way or another, and if you are interested in details on how to fully implement these alternatives in your IBM Cognos Analytics environment, feel free to contact us at bi_odjel@comping.hr

